PlotPoints!
-
Category Education
-
Rating 3.33333
-
Size 1.0 MB
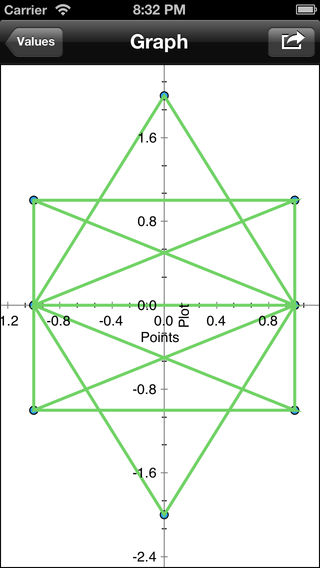
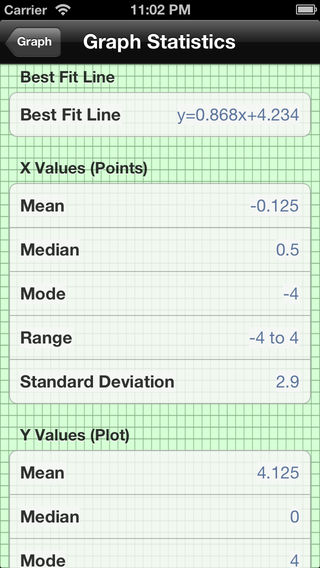
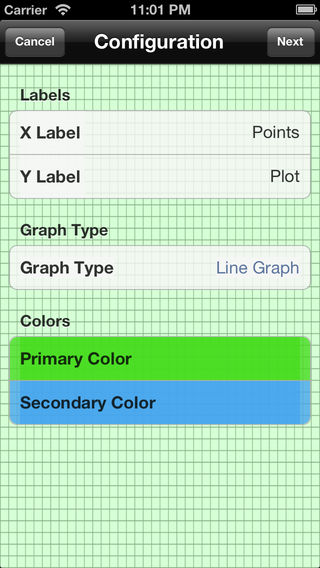
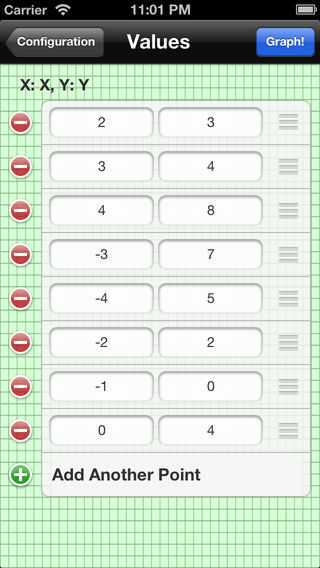
Never waste time or money on graph paper again Have you ever wanted to plot some points, but were too lazy to graph them on paper?PlotPoints allows you to digitally plot any points that you need. After its done, you can view the best fit line and standard deviation of your data. FEATURES:- Plot any graph with as many points as you want (limit 5 points without Pro)- Print the graph for immediate use- Get statistical data for all graphs, including: Best fit line Mean, median, mode, range Standard deviation- Choose any custom colors for the graph (available only in Pro)- Share your graphs by Facebook, Twitter, or Email- Save your graphs for later access (available only in Pro)- Choose between area, line, or bar graphs- Change the X and Y labels to your custom requirementsUPGRADE TO PRO inside the app This app is a perfect fit for any middle or high school student involved in Algebra, Geometry, Precalculus, Calculus, Chemistry, Biology, Physics, and any other math or science classes