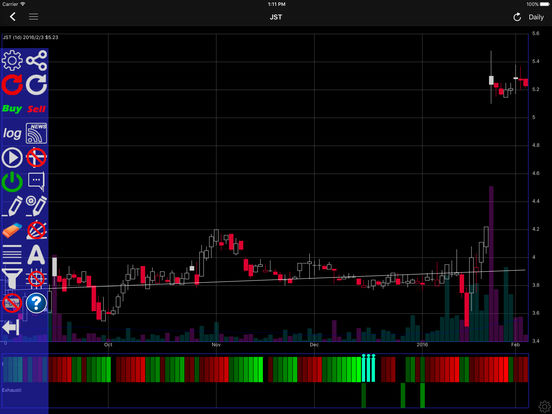
Interactive Stock Charts!
-
Category Finance
-
Size 20.2 MB
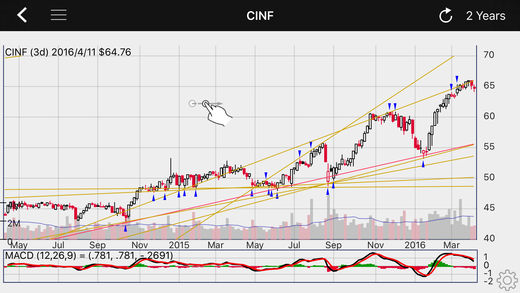
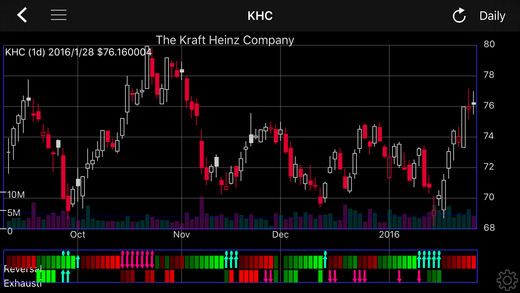
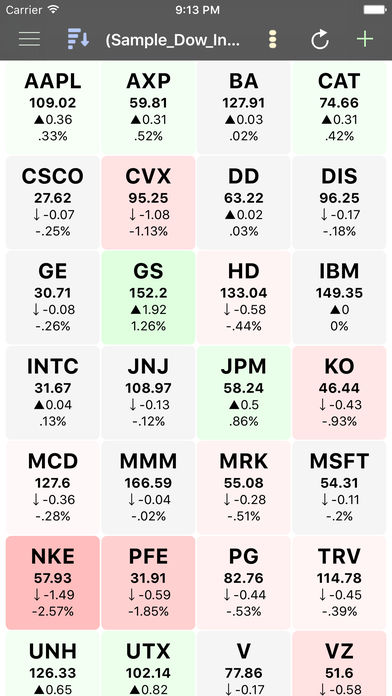
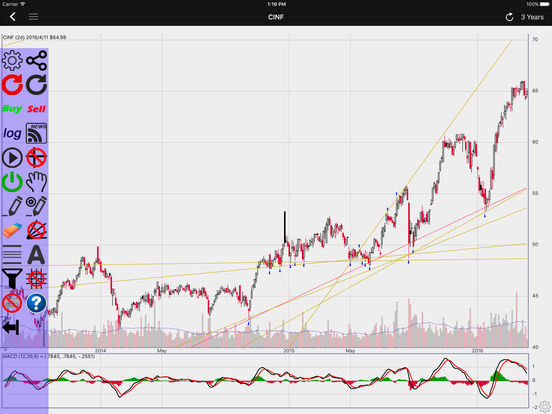
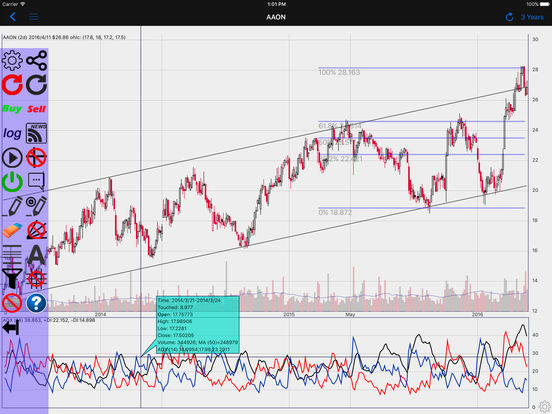
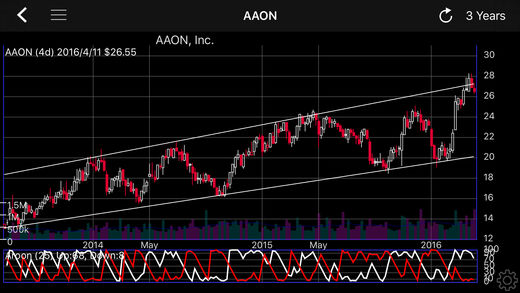
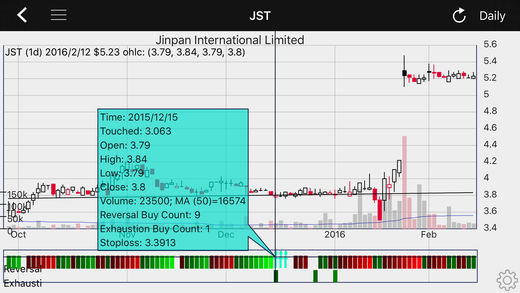
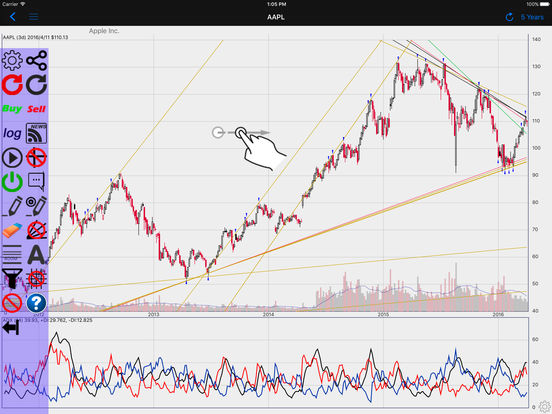
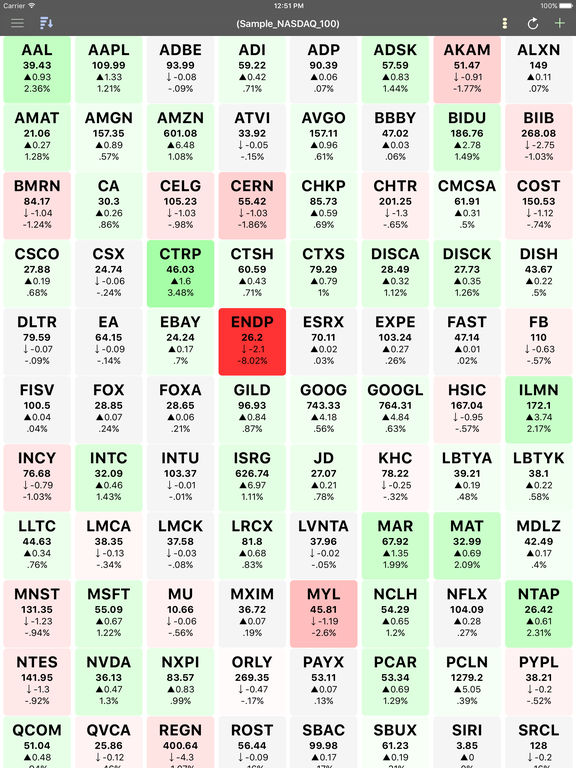
Interactive Stock Charts is the most intuitive and advanced stock analysis charting app. You can freely adjust time frame and view technical information with touch of finger: scroll, pan and zoom on a beautiful candlestick charts with gesture and touch control. Supported markets:EOD and intraday data: NASDAQ, NYSE, AMEX, TSX, HKEX, Australia, India (NSE) EOD data only: JKSE, Shenzhen, Shanghai, Singapore, UK, Paris, Brussels, Amsterdam, Milan, AthensFOREX: All Forex currency pairs