-
Category Finance
-
Rating 5
-
Size 17.5 MB
Reverse RSI Calculator by Screenulator This app calculates RSI values and reverse RSI values (future stock prices of given RSI levels), therefore allowing you to set limit or stop prices at any desired RSI levels. It supports multiple RSI time periods, and RSI levels. Calculation is done by Screenulato, which is a proprietary technical analysis algorithms and chart pattern screeners for financial markets.- Near real time stock quotes and RSI calculations- Any RSI time period from 2 to 400- Get multiple RSI levels at press of a button - Auto-complete text for instant stock symbol search - 15+ Supported markets: NASDAQ, NYSE, AMEX, TSX, HKEX, Australia, India (NSE), JKSE, Shenzhen, Shanghai, Singapore, UK, Paris, Brussels, Amsterdam, Milan, Athens
rRSI Calculator Free alternatives
Candlestick Charting
This App, Candlestick Charting integrated with Technical Analysis, gives you the tools you need to help you become a successful trader. It provides the following benefits to help you in your trading plan:* Candlestick Patterns - Detects more than 70 of the most widely recognizable candlestick patterns providing key patterns for trend reversals. You assume all risk associated with using the data provided herein and in no way can the developer of this App assume any liability.
-
rating 4.75
-
size 14.2 MB
iStockPicks
iStockPicks is a clean, elegant application that helps you pick stocks to trade, and recommends trading them when technical analysis indicates that it is a good time to buy/sell. It does this with a powerful custom Recommendation Engine that loads historic stock data for a given stock ticker (like AAPL for Apple, Inc.) calculates values like the RSI indicator, MACD, and Bollinger Bands, and then uses those indicators to suggest Buy/Sell/Neutral ratings on the stock This app is free to try, letting you test out its analysis without dropping the piles of money up front that other similar iPad/iPhone apps require. Do your own stock research to verify conclusions reached by using this application.
-
size 4.8 MB
Stock Value Analyzer Lite
Stock Value Analyzer helps you research stocks by analyzing over 20,000 securities from the US, Australia, Canada, France, Germany, Italy, Netherlands, Spain, Sweden, and the United Kingdom Stock Value Analyzer provides instant access to growth rates, charts, Value Prices, Margin of Safety Prices, and other figures you need to find the best stocks on the market FEATURES Stock Value Analyzer Lite allows user to analyze individual stocks and maintains history of stocks analyzed. The results of analysis include:Growth Rates Consistent, positive growth indicates a stable company with predictable results. Stock2own is also catching crossing events and Alert considered a buy or a sell signal on a day when the price line is crossing the moving average line.
-
size 26.2 MB

Fourier Predictor
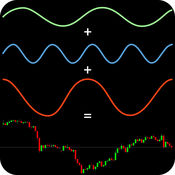
Dear traders and all the people who are interested in stocks, indexes, currencies, etc. movements watch,all of you would like to look into the future to trade better, yes? And now you can use http://chebscan.com/fourier to scan a whole world market to find suitable stocks movements using Fourier Prediction Model
-
size 5.3 MB


