-
Category Utilities
-
Size 14.4 MB
IciView is an event viewer for Icinga 2.Icinga is an open source computer system and network monitoring application. It was originally created as a fork of the Nagios system monitoring application in 2009.Acknowledge a single event by swiping left on an event.Acknowledge multiple events by selecting them and using the button in the menu. Filter events by status and/or severity.
IciView - Event Viewer alternatives
Network Analyzer - wifi scanner, speed test, tools
The ultimate tool for network analysis, LAN scanning and problem detection. Network Analyzer can help you diagnose various problems in your wifi network setup, Internet connectivity, and also detect various issues on remote servers thanks to the wide range of tools it provides. Everything works with both IPv4 and IPv6.WIFI LAN SCANNER Fast and reliable detection of all network devices (wifi & VPN) IP addresses of all discovered devices NetBIOS, mDNS (bonjour), LLMNR, and DNS name where available Pingability test of discovered devices IPv6 availability and discovered IPv6 addresses Wake on LAN (WOL) including remote WOL Scan of custom IP ranges Filtering and search in the discovered device listPING & TRACEROUTE Round trip delay including IP address and hostname for every network node Geolocation data including latitude, longitude, country, city, and time zone AS number and network name information Complete trace route visualization on the map Graphical ping statistics updated in real time Configurable ICMP/UDP probes for traceroute Configurable ping payload size Both IPv4 and IPv6 - selectablePORT SCANNER Fast, adaptive algorithm for scanning the most common ports or user specified port ranges Detection of closed, firewalled, and open ports Description of the known open port services Scan of complete port range or user-editable common ports Both IPv4 and IPv6 - selectableWHOIS Whois of domains, IP addresses and AS numbers DNS LOOKUP Functionality similar to nslookup or dig Support of ANY, A, AAAA, CAA, CNAME, HINFO, MX, NS, PTR, SOA, SPF, SRV, SSHFP, TLSA, TXT records Decoding and showing DNSSEC records such as DNSKEY, CDNSKEY, RRSIG, NSEC3PARAM, NSEC, NSEC3, DS, CDS INTERNET SPEED Test of both download and upload speeds Graphical speed test view Speed test history NETWORK INFORMATION Default gateway, external IP (v4 and v6), DNS server, HTTP proxy Wifi network information such as SSID, BSSID, IP address, and subnet mask Cell (3G, LTE) network information such as IP address, network provider, MCC, MNC Monitor of wifi, cell and VPN data usage (both sent and received data since the last boot) LOCAL SERVICE DISCOVERY Bonjour service browser UPNP/DLNA service and device browserMORE Full IPv6 support everywhere History of all performed tasks with the possibility to star the favorite ones Export by email, AirPrint, and AirDrop for most tools Copy/paste support Detailed help Regular updates, support page
-
rating 4.59999
-
size 15.6 MB
easyNag
easyNag is a simple and easy to use app which gives you quick access to your Nagios, Icinga, Thruk/Naemon, or Check_MK monitoring system. Setup:Just add a new instance with the URL of your monitoring system, your username and password. URL scheme:Open host: easynag://?host=HOST&instance=EASYNAG_INSTANCE_NAMEOpen service: easynag://?host=HOST&service=SERVICE&instance=EASYNAG_INSTANCE_NAMEAcknowledge host: easynag://?host=HOST&instance=EASYNAG_INSTANCE_NAME&action=ackAcknowledge service: easynag://?host=HOST&service=SERVICE&instance=EASYNAG_INSTANCE_NAME&action=ackFor further help, check out the FAQs at our website.
-
size 19.9 MB
PagerDuty
PagerDuty is the leading digital operations management platform for businesses. Through its SaaS-based platform, PagerDuty empowers developers, DevOps, IT operations and business leaders to prevent and resolve business-impacting incidents for exceptional customer experience. Some features availability depends on your PagerDuty plan.
-
size 60.0 MB
MobiosPush
MobiosPush is the ultimate Nagios, Icinga and Thruk frontend for your iPhone. It is the only client for iPhone that has built-in push notifications. The other functions of the app work normally.
-
size 20.0 MB
Pushover Notifications
Pushover is a simple push notification service that integrates easily into web apps like IFTTT, network monitoring systems, shell scripts, and anything else that needs to send alerts to your iPhone, iPad, Desktop, and other robot-like mobile devices. App has a free 7-day trial and unlimited usage beyond the trial requires a one-time in-app purchase. Pushover includes an Apple Watch app and complications so you can push custom data straight to your watch face with our Glances API.Visit https://pushover.net/ to find apps, plugins, and services that support Pushover, or get an API key for your own app.
More Information About alternatives
OnCall for Nagios
OnCall for Nagios is a simple, intuitive, and powerful interface to your existing Nagios installation. Setup is easy - just enter your Nagios url (and optional username/password for HTTP authentication) - it just works. Simply use nagiosss:// instead of http:// or https:// with the standard nagios url format that includes ?host=#alias#&service=#service_name# examples:nagiosss://nagios.domain.com/nagios/cgi-bin/extinfo.cgi?host=web01&service=load* single, concise, summary view of problems for both hosts and services with highlights for warning/critical/acknowledged/silenced/downtime issues* multiple nagios instance settings* ability to see service level detail* perform actions on a host with quick access from problems view* easy to see status coloring and notification state from problems view* ability to filter the services shown on the problems view based on state* ability to quickly acknowledge an issue with a user specified default message (swipe to acknowledge on problems view)* ability to acknowledge an issue with a custom, one-time, message* ability to reschedule another check of a service* ability to schedule downtime for a service* browse hosts by all, service-group, and host-group* server timezone setting (hour offset) per nagios instance NOTE: fully tested with nagios 3.x
-
rating 3.14286
-
size 4.4 MB
-
version 2.1
OnCall Lite for Nagios
OnCall for Nagios is a simple, intuitive, and powerful interface to your existing Nagios installation. Setup is easy - just enter your Nagios url (and optional username/password for HTTP authentication) - it just works. Features: * single, concise, summary view of problems for both hosts and services with highlights for warning/critical/acknowledged issues * multiple nagios instance settings * ability to see service level detail * perform actions on a host with quick access from problems view * easy to see status coloring and notification state from problems view * ability to filter the services shown on the problems view based on state * ability to quickly acknowledge an issue with a user specified default message (swipe to acknowledge on problems view) * ability to acknowledge an issue with a custom, one-time, message * ability to reschedule another check of a service * ability to schedule downtime for a service * browse hosts by all, service-group, and host-group * server timezone setting (hour offset) per nagios instance NOTE: fully tested with nagios 3.xThe LITE version imposes the following restrictions: * only a single Nagios instance * only 2 problems will be displayed * only 2 hosts will be displayed * only 2 host/service groups will be displayed * only 2 services will be displayed * cannot schedule downtime * cannot reschedule a service check
-
size 4.3 MB
-
version 2.1
Zen Ops View
ZenOSS is the popular Open source monitoring platform. Zen Ops View is THE iOS mobile application for viewing and management of your ZenOSS Server on iOS Features :Connecting to Internal or External ZenOSS servers 3.x and 4.x Display events of different typesView details of eventsView / modify event logAllow acknowledgment of eventsClose eventsMultiple account supportFilter events based on severity, production state, and acknowledgment status.- Infrastructure view (Available as an In-App Purchase)- View device info- Make changes to devices- View resource graphs , components and other details.
-
size 15.0 MB
-
version 1.7.5
Aliro 1
The Aliro application offers user convenience with remote administration and real time monitoring of a system whilst on the move directly from a mobile device. It enables users to view the system dashboard and status in real time. The built-in filter features can be used for quick, easy and clear event analysis.
-
size 10.4 MB
-
version 1.15
Dell Wyse Management Suite
Dells new Wyse Management Suite application is simple, fast and secure. Its designed specifically to enable IT administrators to have on-the-go access to critical device management functionality. Alerts:- Get notified in real-time when alerts are triggered- Acknowledge and dismiss alerts Manage:- Sign-on once and stay logged in- Dashboard to view alerts by severity and device summary - View devices and filter by group if necessary- Perform critical device operations by sending commands like lock, restart, shutdown and un-register to one or more devices - View job status and monitor events
-
size 4.7 MB
-
version 1.0
IMS Ticker
IMS Ticker allows you to view live events as they are recorded by the IMS seismic system. Events include automatically processed events, events marked as blasts and events processed by human processors. Features:After registering to receive live seismic event information as recorded by the system, you can:* View detailed event information, including the number of seismic stations triggered, location, source parameters, the nearest 2D and/or 3D workplace and the association group it belongs to* Filter the displayed events* Switch between databases if more than one database is available* Receive significant event notifications* E-mail events of interest to your contacts* Transfer data securely over SSL
-
size 20.0 MB
-
version 1.4
IBM Storage Mobile Dashboard
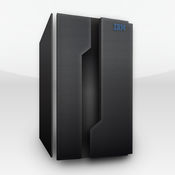
IBM Storage Mobile Dashboard is a free application that provides basic monitoring capabilities for IBM storage systems. Storage administrators can securely check the health and performance status of their IBM Storage systems by viewing events as well as real time performance metrics. Supported storage platforms: IBM Flex System V7000 Storage Node IBM Storwize V5000 IBM Storwize V3700/V3500 IBM Storwize V7000/V7000 Unified IBM Storwize V7000 Gen2 IBM SAN Volume Controller (SVC) FlashSystem 840 FlashSystem 900 FlashSystem V840 FlashSystem V9000 IBM XIV Storage System IBM FlashSystem A9000 IBM FlashSystem A9000R IBM TS4500 Tape Library IBM SAN Volume Controller DH8 nodeKey features of the IBM Mobile Dashboard app include: Secure access to multiple IBM Storage systems using an SSL connection over Wi-Fi or 3G link Add any number of systems to the monitored systems list; Once added, the system address and credentials are safely saved for future sessions View current system performance metrics, including IOPs and latency View current system capacity utilization View top performing volumes and hosts on an XIV Storage System, FlashSystem A9000, or FlashSystem A9000R View volume performance, remote copy, CPU utilization, cache utilization, interface BW and detailed capacity utilization on a Storwize system View system events and receive online updates; Filter events by severity Zoom in on each system for a closer look of the systems configuration
-
size 50.3 MB
-
version 1.5.6
CTCAE v4.0 Mobile
A FREE viewer for Common Terminology Criteria for Adverse Events (CTCAE) v4.03 (MedDRA v12.0) - 14/JUN/2010See more information: https://nice2seeu.github.io/ctcae/en/index.html Features Smart Flag (Just by swiping, add/remove a flag to an itmes and show the flagged items. )- Add a flag / Remove a flag Swipe RIGHT on a CTCAE item.- Show all flagged items / Show all items Swipe LEFT on an arbitrary CTCAE item.- Remove all flags Press hold on clear button until confirmation dialog appears. Search for events across names, grades and definitions in Japanese and English Highlighting searched text Horizontal view of grades
-
size 4.3 MB
-
version 2.5.7
CTCAE v4.0 Japanese translation
A FREE viewer for Common Terminology Criteria for Adverse Events (CTCAE) v4.0 Japanese translation JCOG versionCTCAE v4.03/MedDRA v12.0(MedDRA/J v19.0) - 10/Mar/2016See more information in Japanese : https://nice2seeu.github.io/ctcae/ja/index.html Features Smart Flag (Just by swiping, add/remove a flag to an itmes and show the flagged items. )- Add a flag / Remove a flag Swipe RIGHT on a CTCAE item.- Show all flagged items / Show all items Swipe LEFT on an arbitrary CTCAE item.- Remove all flags Press hold on clear button until confirmation dialog appears. Please contact JCOG.
-
size 5.1 MB
-
version 2.5.8
Mipatek Kml Viewer
Mipatek KML Viewer application AutoCAD, NetCAD, drawing you created in programs such as ArcGIS WGS84 Datum you get output in accordance with the 6 UTM system can display KML or KMZ files on the device. Prepared drawings (zoning plan is built, the site plan and so on.) You can add KML or KMZ files from other apps (such as Mail) or connecting your device to your computer via USB to install applications can use the file sharing application from iTunes or in the Start Server You can use your FTP or HTTP client then tap the button.
-
size 4.5 MB
-
version 2.4
